|
|
8 years ago | |
|---|---|---|
| .. | ||
| arrays | 9 years ago | |
| assert | 8 years ago | |
| buffers | 9 years ago | |
| child_process | 9 years ago | |
| crypto | 9 years ago | |
| dgram | 9 years ago | |
| doc_img | 9 years ago | |
| domain | 9 years ago | |
| es | 9 years ago | |
| events | 9 years ago | |
| fixtures | 9 years ago | |
| fs | 8 years ago | |
| http | 8 years ago | |
| misc | 9 years ago | |
| module | 9 years ago | |
| net | 9 years ago | |
| path | 9 years ago | |
| process | 9 years ago | |
| querystring | 9 years ago | |
| streams | 9 years ago | |
| string_decoder | 9 years ago | |
| timers | 9 years ago | |
| tls | 9 years ago | |
| url | 9 years ago | |
| util | 9 years ago | |
| README.md | 8 years ago | |
| _cli.R | 9 years ago | |
| _cli.js | 9 years ago | |
| _http-benchmarkers.js | 8 years ago | |
| common.js | 8 years ago | |
| compare.R | 8 years ago | |
| compare.js | 8 years ago | |
| run.js | 8 years ago | |
| scatter.R | 8 years ago | |
| scatter.js | 9 years ago | |
README.md
Node.js core benchmark
This folder contains benchmarks to measure the performance of the Node.js APIs.
Table of Content
- Prerequisites
- Running benchmarks
- Running individual benchmarks
- Running all benchmarks
- Comparing node versions
- Comparing parameters
- Creating a benchmark
Prerequisites
Most of the HTTP benchmarks require a benchmarker to be installed, this can be
either wrk or autocannon.
Autocannon is a Node script that can be installed using
npm install -g autocannon. It will use the Node executable that is in the
path, hence if you want to compare two HTTP benchmark runs make sure that the
Node version in the path is not altered.
wrk may be available through your preferred package manger. If not, you can
easily build it from source via make.
By default wrk will be used as benchmarker. If it is not available
autocannon will be used in it its place. When creating a HTTP benchmark you
can specify which benchmarker should be used. You can force a specific
benchmarker to be used by providing it as an argument, e. g.:
node benchmark/run.js --set benchmarker=autocannon http
node benchmark/http/simple.js benchmarker=autocannon
To analyze the results R should be installed. Check you package manager or
download it from https://www.r-project.org/.
The R packages ggplot2 and plyr are also used and can be installed using
the R REPL.
$ R
install.packages("ggplot2")
install.packages("plyr")
Running benchmarks
Running individual benchmarks
This can be useful for debugging a benchmark or doing a quick performance measure. But it does not provide the statistical information to make any conclusions about the performance.
Individual benchmarks can be executed by simply executing the benchmark script with node.
$ node benchmark/buffers/buffer-tostring.js

buffers/buffer-tostring.js n=10000000 len=0 arg=true: 62710590.393305704
buffers/buffer-tostring.js n=10000000 len=1 arg=true: 9178624.591787899
buffers/buffer-tostring.js n=10000000 len=64 arg=true: 7658962.8891432695
buffers/buffer-tostring.js n=10000000 len=1024 arg=true: 4136904.4060201733
buffers/buffer-tostring.js n=10000000 len=0 arg=false: 22974354.231509723
buffers/buffer-tostring.js n=10000000 len=1 arg=false: 11485945.656765845
buffers/buffer-tostring.js n=10000000 len=64 arg=false: 8718280.70650129
buffers/buffer-tostring.js n=10000000 len=1024 arg=false: 4103857.0726124765
Each line represents a single benchmark with parameters specified as
${variable}=${value}. Each configuration combination is executed in a separate
process. This ensures that benchmark results aren't affected by the execution
order due to v8 optimizations. The last number is the rate of operations
measured in ops/sec (higher is better).
Furthermore you can specify a subset of the configurations, by setting them in the process arguments:
$ node benchmark/buffers/buffer-tostring.js len=1024

buffers/buffer-tostring.js n=10000000 len=1024 arg=true: 3498295.68561504
buffers/buffer-tostring.js n=10000000 len=1024 arg=false: 3783071.1678948295
Running all benchmarks
Similar to running individual benchmarks, a group of benchmarks can be executed
by using the run.js tool. Again this does not provide the statistical
information to make any conclusions.
$ node benchmark/run.js arrays

arrays/var-int.js
arrays/var-int.js n=25 type=Array: 71.90148040747789
arrays/var-int.js n=25 type=Buffer: 92.89648382795582
...

arrays/zero-float.js
arrays/zero-float.js n=25 type=Array: 75.46208316171496
arrays/zero-float.js n=25 type=Buffer: 101.62785630273159
...

arrays/zero-int.js
arrays/zero-int.js n=25 type=Array: 72.31023859816062
arrays/zero-int.js n=25 type=Buffer: 90.49906662339653
...
It is possible to execute more groups by adding extra process arguments.
$ node benchmark/run.js arrays buffers
Comparing node versions
To compare the effect of a new node version use the compare.js tool. This
will run each benchmark multiple times, making it possible to calculate
statistics on the performance measures.
As an example on how to check for a possible performance improvement, the
#5134 pull request will be used as
an example. This pull request claims to improve the performance of the
string_decoder module.
First build two versions of node, one from the master branch (here called
./node-master) and another with the pull request applied (here called
./node-pr-5135).
The compare.js tool will then produce a csv file with the benchmark results.
$ node benchmark/compare.js --old ./node-master --new ./node-pr-5134 string_decoder > compare-pr-5134.csv
For analysing the benchmark results use the compare.R tool.
$ cat compare-pr-5134.csv | Rscript benchmark/compare.R

                                                                                      improvement significant      p.value
string_decoder/string-decoder.js n=250000 chunk=1024 inlen=1024 encoding=ascii           12.46 %         *** 1.165345e-04
string_decoder/string-decoder.js n=250000 chunk=1024 inlen=1024 encoding=base64-ascii    24.70 %         *** 1.820615e-15
string_decoder/string-decoder.js n=250000 chunk=1024 inlen=1024 encoding=base64-utf8     23.60 %         *** 2.105625e-12
string_decoder/string-decoder.js n=250000 chunk=1024 inlen=1024 encoding=utf8            14.04 %         *** 1.291105e-07
string_decoder/string-decoder.js n=250000 chunk=1024 inlen=128  encoding=ascii            6.70 %           * 2.928003e-02
...
In the output, improvement is the relative improvement of the new version,
hopefully this is positive. significant tells if there is enough
statistical evidence to validate the improvement. If there is enough evidence
then there will be at least one star (*), more stars is just better. However
if there are no stars, then you shouldn't make any conclusions based on the
improvement. Sometimes this is fine, for example if you are expecting there
to be no improvements, then there shouldn't be any stars.
A word of caution: Statistics is not a foolproof tool. If a benchmark shows
a statistical significant difference, there is a 5% risk that this
difference doesn't actually exists. For a single benchmark this is not an
issue. But when considering 20 benchmarks it's normal that one of them
will show significance, when it shouldn't. A possible solution is to instead
consider at least two stars (**) as the threshold, in that case the risk
is 1%. If three stars (***) is considered the risk is 0.1%. However this
may require more runs to obtain (can be set with --runs).
For the statistically minded, the R script performs an independent/unpaired
2-group t-test, with the null hypothesis that the performance is the
same for both versions. The significant field will show a star if the p-value
is less than 0.05.
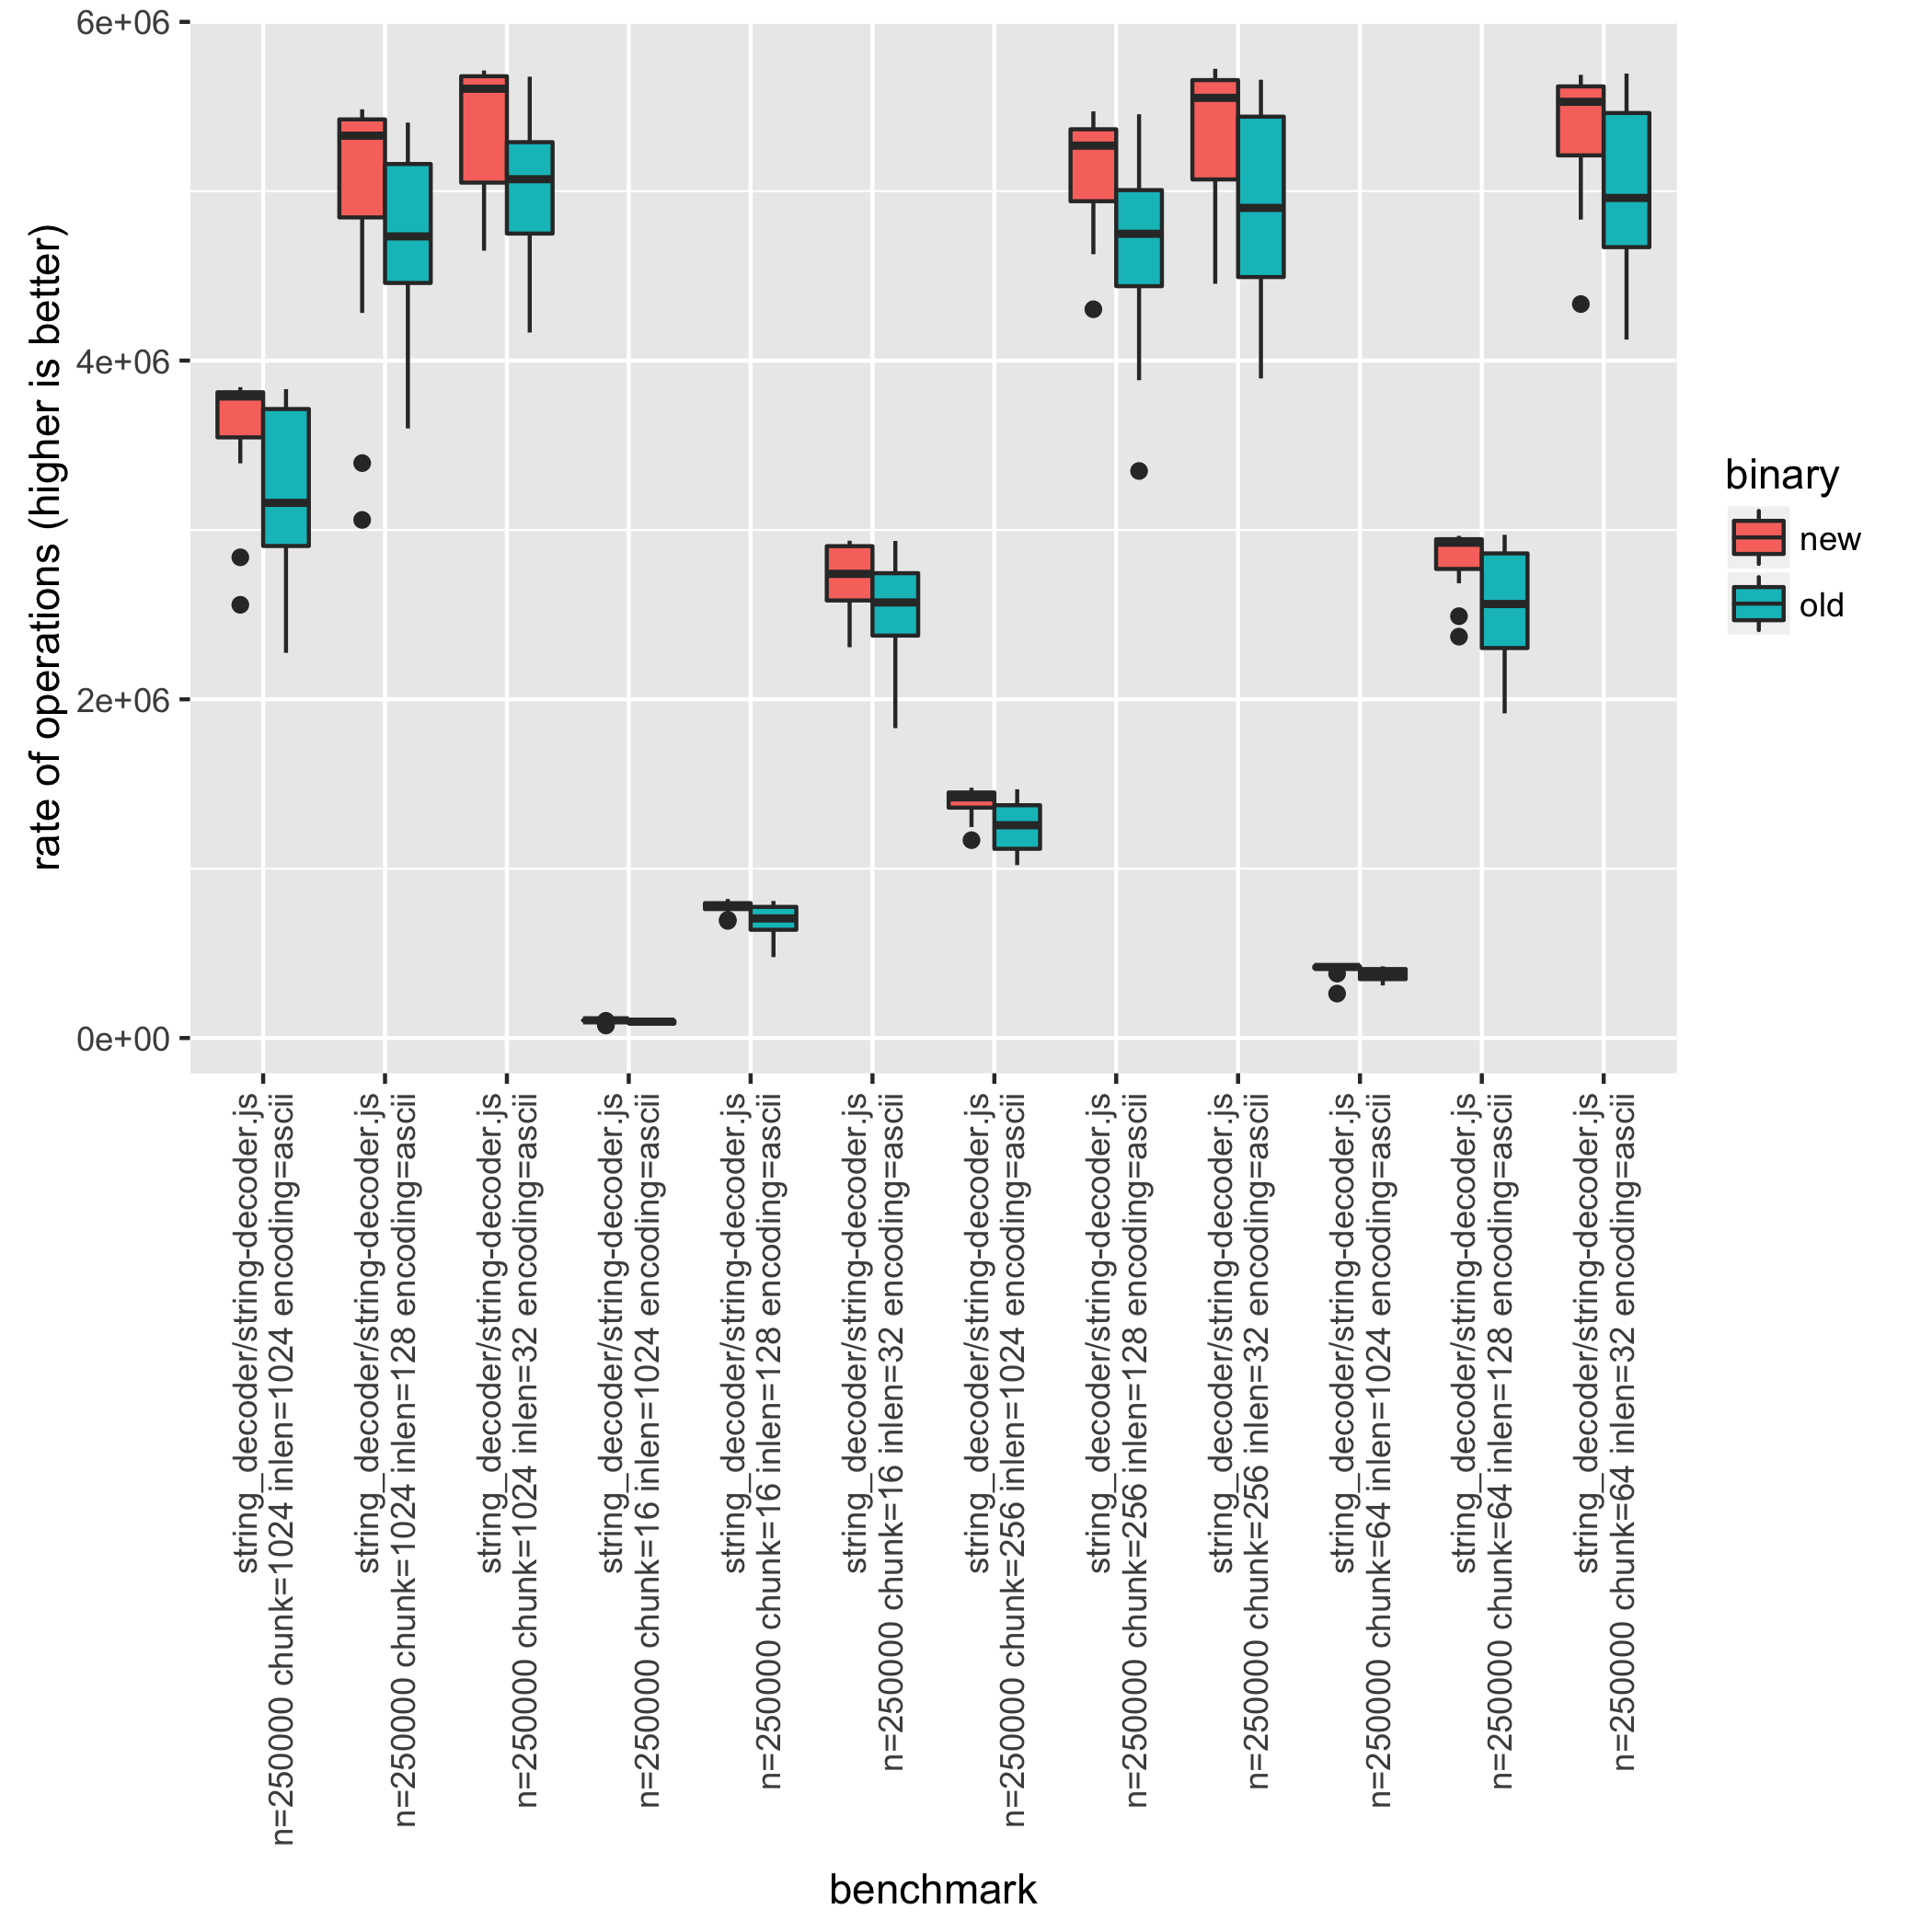
The compare.R tool can also produce a box plot by using the --plot filename
option. In this case there are 48 different benchmark combinations, thus you
may want to filter the csv file. This can be done while benchmarking using the
--set parameter (e.g. --set encoding=ascii) or by filtering results
afterwards using tools such as sed or grep. In the sed case be sure to
keep the first line since that contains the header information.
$ cat compare-pr-5134.csv | sed '1p;/encoding=ascii/!d' | Rscript benchmark/compare.R --plot compare-plot.png

                                                                               improvement significant      p.value
string_decoder/string-decoder.js n=250000 chunk=1024 inlen=1024 encoding=ascii    12.46 %         *** 1.165345e-04
string_decoder/string-decoder.js n=250000 chunk=1024 inlen=128 encoding=ascii      6.70 %           * 2.928003e-02
string_decoder/string-decoder.js n=250000 chunk=1024 inlen=32 encoding=ascii       7.47 %         *** 5.780583e-04
string_decoder/string-decoder.js n=250000 chunk=16 inlen=1024 encoding=ascii       8.94 %         *** 1.788579e-04
string_decoder/string-decoder.js n=250000 chunk=16 inlen=128 encoding=ascii       10.54 %         *** 4.016172e-05
...
Comparing parameters
It can be useful to compare the performance for different parameters, for example to analyze the time complexity.
To do this use the scatter.js tool, this will run a benchmark multiple times
and generate a csv with the results.
$ node benchmark/scatter.js benchmark/string_decoder/string-decoder.js > scatter.csv
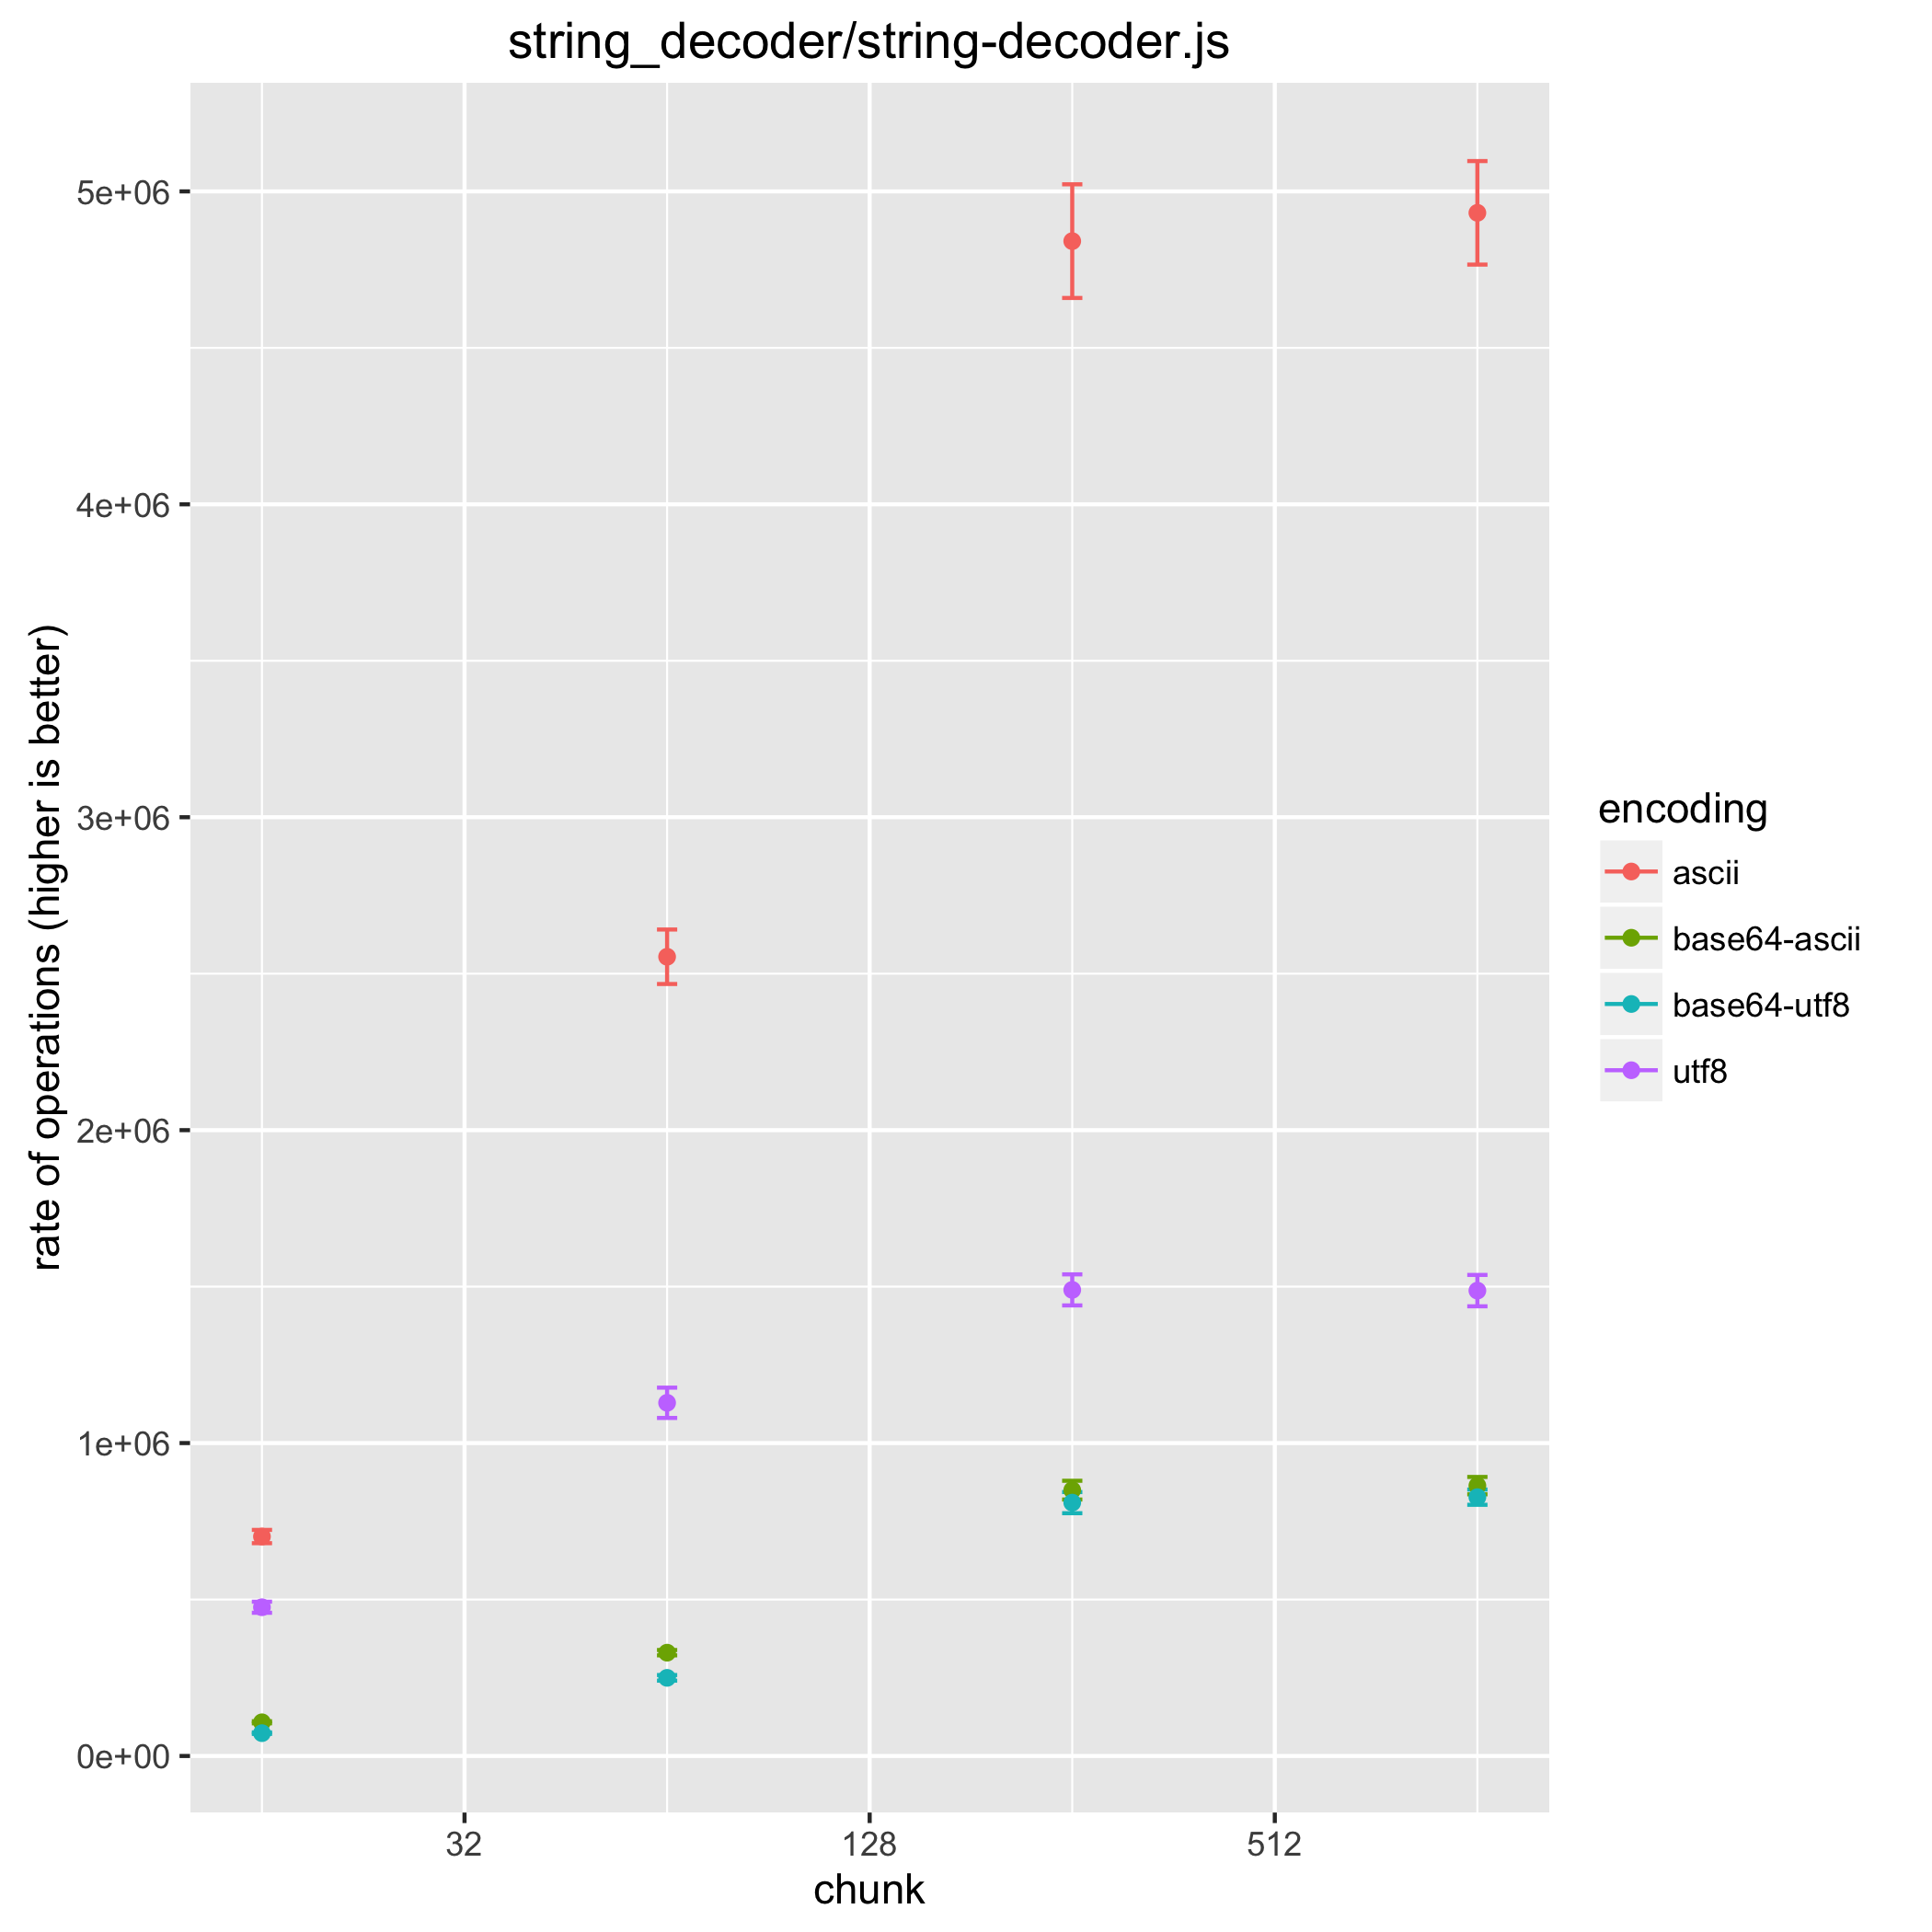
After generating the csv, a comparison table can be created using the
scatter.R tool. Even more useful it creates an actual scatter plot when using
the --plot filename option.
$ cat scatter.csv | Rscript benchmark/scatter.R --xaxis chunk --category encoding --plot scatter-plot.png --log

aggregating variable: inlen

chunk     encoding      mean confidence.interval
   16        ascii 1111933.3           221502.48
   16 base64-ascii  167508.4            33116.09
   16  base64-utf8  122666.6            25037.65
   16         utf8  783254.8           159601.79
   64        ascii 2623462.9           399791.36
   64 base64-ascii  462008.3            85369.45
   64  base64-utf8  420108.4            85612.05
   64         utf8 1358327.5           235152.03
  256        ascii 3730343.4           371530.47
  256 base64-ascii  663281.2            80302.73
  256  base64-utf8  632911.7            81393.07
  256         utf8 1554216.9           236066.53
 1024        ascii 4399282.0           186436.46
 1024 base64-ascii  730426.6            63806.12
 1024  base64-utf8  680954.3            68076.33
 1024         utf8 1554832.5           237532.07
Because the scatter plot can only show two variables (in this case chunk and
encoding) the rest is aggregated. Sometimes aggregating is a problem, this
can be solved by filtering. This can be done while benchmarking using the
--set parameter (e.g. --set encoding=ascii) or by filtering results
afterwards using tools such as sed or grep. In the sed case be
sure to keep the first line since that contains the header information.
$ cat scatter.csv | sed -E '1p;/([^,]+, ){3}128,/!d' | Rscript benchmark/scatter.R --xaxis chunk --category encoding --plot scatter-plot.png --log

chunk     encoding       mean confidence.interval
   16        ascii  701285.96           21233.982
   16 base64-ascii  107719.07            3339.439
   16  base64-utf8   72966.95            2438.448
   16         utf8  475340.84           17685.450
   64        ascii 2554105.08           87067.132
   64 base64-ascii  330120.32            8551.707
   64  base64-utf8  249693.19            8990.493
   64         utf8 1128671.90           48433.862
  256        ascii 4841070.04          181620.768
  256 base64-ascii  849545.53           29931.656
  256  base64-utf8  809629.89           33773.496
  256         utf8 1489525.15           49616.334
 1024        ascii 4931512.12          165402.805
 1024 base64-ascii  863933.22           27766.982
 1024  base64-utf8  827093.97           24376.522
 1024         utf8 1487176.43           50128.721
Creating a benchmark
All benchmarks use the require('../common.js') module. This contains the
createBenchmark(main, configs) method which will setup your benchmark.
The first argument main is the benchmark function, the second argument
specifies the benchmark parameters. createBenchmark will run all possible
combinations of these parameters, unless specified otherwise. Note that the
configuration values can only be strings or numbers.
createBenchmark also creates a bench object, which is used for timing
the runtime of the benchmark. Run bench.start() after the initialization
and bench.end(n) when the benchmark is done. n is the number of operations
you performed in the benchmark.
'use strict';
const common = require('../common.js');
const SlowBuffer = require('buffer').SlowBuffer;

const bench = common.createBenchmark(main, {
  n: [1024],
  type: ['fast', 'slow'],
  size: [16, 128, 1024]
});

function main(conf) {
  bench.start();

  const BufferConstructor = conf.type === 'fast' ? Buffer : SlowBuffer;

  for (let i = 0; i < conf.n; i++) {
    new BufferConstructor(conf.size);
  }
  bench.end(conf.n);
}
Creating HTTP benchmark
The bench object returned by createBenchmark implements
http(options, callback) method. It can be used to run external tool to
benchmark HTTP servers.
'use strict';

const common = require('../common.js');

const bench = common.createBenchmark(main, {
  kb: [64, 128, 256, 1024],
  connections: [100, 500]
});

function main(conf) {
  const http = require('http');
  const len = conf.kb * 1024;
  const chunk = Buffer.alloc(len, 'x');
  const server = http.createServer(function(req, res) {
    res.end(chunk);
  });

  server.listen(common.PORT, function() {
    bench.http({
      connections: conf.connections,
    }, function() {
      server.close();
    });
  });
}
Supported options keys are:
port- defaults tocommon.PORTpath- defaults to/connections- number of concurrent connections to use, defaults to 100duration- duration of the benchmark in seconds, defaults to 10benchmarker- benchmarker to use, defaults tocommon.default_http_benchmarker

